Sunday, May 7, 2017

Taking UAS Data in the Field

Introduction:

There are multiple steps to taking good UAS data and it is important that each one of them is completed to maintain data integrity and consistency.   This lab will discuss the process of taking UAS data from mission planning to the actual flight.

Process:

Before leaving to the field it is important to make a mission plan and make sure all items that are needed are charged and ready to go.  The mission plan will allow for an efficient use of time and background knowledge of the area.  These flights are to be used as example data and minimal mission planning occurred.  Three flights took place at a community garden in Eau Claire Wi.  Two flights were done with a DJI Phantom 3 Advanced and one practice flight was done with a DJI Inspire 1 Pro.

Before any flights occurred, GCP's were placed in the garden and located with a highly accurate GPS.  The GPS is mounted on a tripod and positioned directly in the center of the GCP.


The tripod has a leveling bubble that was put in the center before taking the coordinates.  This was done so the coordinates were exactly in the center of the GCP.  These coordinates are recorded in a table format to be used during data processing.


After all the GCP's locations were recorded it was time to fly.

Flight one with the Phantom took imagery of the garden with GCP's in place.  The Pix4D capture app was used to plan and fly this mission.  The shape of where to fly, and flight settings are entered on the app and the mission is ready to go.  The remote pilot-in-command took off and brought the UAS up to a safe altitude.  The mission was then started on the app and the UAS rose to the proper altitude and began flying the proper pattern.  When the mission was done, the UAS returned to the position it took off from and automatically landed.


Flight 2 was a flight done over the cars parked on the road to create a 3d image.  This was done by changing the angle of the camera in the mission planning software.  The oblique imagery allows for 3d maps to be created.  The same process was used to take off and fly the mission as the first flight.

The 3rd flight was done with the Inspire and was just to let student manually maneuver the UAS in flight.  It was manually taken off and then the controller was passed around to let students familiarize themselves with flying.  After many hours using flight simulator, flying a real UAS felt very natural.  The Inspire is an impressive drone with removable cameras that allow the user to take a variety of data.


The data taken was put into Pix4D


Tuesday, May 2, 2017

Making GCP's

Introduction:

Ground controls points are panels that are set on the ground of a site that is going to be flown with a UAS.  These panels are marked with a highly accurate GPS and the point locations are then put into the image processing software.  The points are then matched with the imagery and optimized.  This weeks the class physically created GCP panels from scratch.

Process:

The process started with cutting equally sized squares from sheets of black polyurethane.  These squares were then painted to have a two tone look with an easily identifiable center.  The GCP's were also numbered and painted on accordingly.  This process went very fast with around 14 people helping.    

The first step after cutting the sheets of polyurethane was to use a stencil to spray paint a pattern that allows for the middle to be easily identifiable.  This is important when processing the data.


A high visibility pink paint was used to break up the black surface.  A high visibility yellow paint was then used to number each GCP.  This will come in handy when tying the imagery down in the processing.


In the end the 16 GCP's were created.  The image below shows the finished product.


GCP's are important tools to tie down imagery to where is actually is on the earth.  Creating GCP's is easy, cheap and allows for highly accurate data. It is a necessary step to do when taking UAS data. 

Monday, April 24, 2017

UAS Mission Planning Essentials

Introduction:

Mission planning is very important when conducting UAS flights.  Time and equipment is expensive when taking imagery and mission planning can streamline the amount of time in the field.  There are multiple steps in mission planning that range from before the flight in the office to the departure of the office and finally in the field.  This lab will go over the whole process of mission planning and go over a software demonstration with the C-Astral Mission Planning Software.

In the Office:

Before you depart from the office it is important to do research on a few things about the study site.

  • Know the study site
    • Will there be cell signal?
    • Will there be a crowd? Unless properly licensed,  UAS operators cannot fly over crowds. 
  • Know the vegetation
  • Know the terrain
  • Draw out several possible mission plans
    • Use geospatial data available
  • Prepare equipment
    • Charge Batteries

Departure:

Right before leaving to perform the flights it is important to do a couple things before you go.

  • Go over an equipment checklist to make sure nothing is being left behind.
  • Do a final weather check to make sure the weather is good enough for flying

In the Field:

After arriving at the study site things could be different than what previous research on the area showed.  Adjustments will have to be made to the mission plan before the flight takes place.

  • Actual weather in the field
    • Wind Speed, Wind Direction, Temp., Dew Point
  • Assess vegetation
  • Assess terrain
  • Assess electromagnetic interference issues
    • Power lines
    • Underground metal or cables
    • Power stations
  • Get elevation of launch site
  • Establish units team will be using to maintain consistency
  • Reevaluate mission
  • Confirm cellular network connectivity
  • Integrate field observations into pre-flight checks and flight logs

Mission Planning Software:

The C-Astral Mission Planning Software was made by a company who makes high end fixed wing drones.  Bramor developed this software to be used with their UAS.  It is user friendly with many options that brings together standard mission planning with GIS and allows for users to more properly plan their missions.  

This mission planning software comes with a variety of useful features.  One of the most important features is the mission settings.  This is where the user can adjust altitude, speed, overlap, sidelap, resolution, overshoot, camera, and altitude mode. Altitude mode allows the user to select absolute or relative.  Relative means the UAS will adjust elevation if there are changes in elevation of the ground.  This ensures consistent pixel size and makes sure the drone does not hit the ground if flying near a mountain or similar feature.


The image below shows the area points draw feature to plan where the drone should fly.  The user creates a shape around the area they want to fly and the software will create the lines and way points that the drone will fly.  This is an easy way to create a mission for flying a large area. 


A useful feature in this software is the ability to see the mission plan in a 3D view.  The image below shows the flight above in a 3D image.  This is done by using the map button and selecting 3D map.  The user can choose which program the map will open.  In this case ArcGIS Earth was used. 


Another useful feature of this software is that it shows when the flight path is in danger of hitting the ground.  In the image below it knows that the drone will be in danger of hitting the slope of a mountain and creates red dots.  The user can then adjust altitude or other settings to make sure of a
safe flight.


The image below shows the terrain danger issue from above in a 3D map.  You can see on the lower right hand side of the flight the drone will not be able to turn around without crashing into the mountain.  To get around this the user could change the direction of the flight and set the altitude mode to relative so the drone would change elevation with the slope of the mountain.


Another great feature of this program is street points draw feature.  This allows the user to set points along a street and the program will draw way points to fly over the highway.  This would be very useful for a construction company or other companies interested in surveying existing roadways.


The image below is an example of a mission plan of a flight over a residence in Delafield Wisconsin.  Since the author knows the area, the field on the right hand side is the best place to land and take off.  

The mission settings are set to allows for 1 cm resolution.  The terrain allows for the UAS to fly at 75m without endangering the unit. 


Conclusion:

Mission planning is essential to saving time and having safe flights.  The C-Astral Mission Planning software is a great software to use.  It has many valuable features that make flying a mission seamless and easy.


Monday, April 17, 2017

Oblique Imagery to Make 3D Models

Introduction:

UAS imagery flown in a spiral like order around an object with the camera adjusting its orientation to capture images can be turned into a 3D model using Pix4D software.  This lab goes over the process of creating a 3D model using Pix4D and how to annotate it.

Methodology:

The first step to creating a 3D model is to have the proper orientation of the images.  The following image is an example of how the images were taken around a bulldozer at the Litchfield mine.  This flight pattern is necessary to get all the angles needed to create a 3D image.  These images are to be brought into Pix4D and the 3D model template is to be used.

Once the images are loaded the user can create a 3D model by running processing steps one and two.  This will create a 3D Model.  The image below is of a 3D model that was created without doing any additional editing.  The program does not know which pixels are suppose to be the model and which ones are suppose to be the back ground.


To get a 3D model with no distortion the user needs to edit the images using annotation.  This is the process of removing pixels from images that the user does not want included in the background.  This could be the sky, or ground, or a pole obstructing the whatever is the object to be modeled.  Below is an image showing what the annotation process looks like.  The user uses the annotation tool to highlight the area or objects to be annotated then the annotations are applied to the images.


When the annotation process is complete the user re-optimizes the initial processing and runs part two of the processing.  This creates a 3D model using the images that were annotated and removes pixels that are not wanted.  This was done with three different sets of imagery.


Discussion:

In theory annotation will take away all pixels in the image that create distortion.  Unfortunately it is not a perfect process and some of the models did not turn out the way they should have.  The first data set of the bulldozer turned out very distorted with lots of holes in the model.  This could be because of pixels being wrongly removed from the bulldozer and the program then wrongly takes those pixels out of all the images.  This could also have to do with only three images being annotated.  Annotating an image takes a long time to get all of the pixels selected.  The difference between the non-annotated and annotated model of the bulldozer can be seen below.
Pre-Annotations
Post-Annotations

The next model was of a truck parked in a parking lot.  This model turned out better but still not great. 5 images were annotated for this model.  The annotated image is crisper and has less distortion but the bottom of the truck is still very distorted.  This is because no images were taken from that low of an angle and the program did not know what to do with that area.
Pre-Annotation
Post-Annotation

Conclusion:

Annotation is a very useful tool but can be applied in a more useful way than it was in this lab.  Annotation can be used to remove an object like a pole or stick that is interfering with the model.  The application it was used in for this lab resulted in okay results but not perfect.  The bulldozer was left as it was because it seemed good to show that mistakes could be make and the resulting model can turn out bad.  If this were being done again more images would be annotated and they would be done more carefully and the model would turn out much nicer.


Monday, April 10, 2017

Calculating Volumes of Stock Piles Using Pix4D and ESRI Software

Introduction:
Unmanned aerial systems can be used to take data from a mine and to calculate volumes of stock piles using advanced software.  This lab goes over this process for sand piles at the Litchfield mine.
Volumetric analysis is important for a company that wants to find out how much material they have removed and have laying in piles in the mine.  The implementation of UAS can be key to getting extremely accurate figures in a very short amount of time.  This lab will go over using Pix4D to get these figures as well as doing it in ArcMap.  

There are multiple tools in Arcmap that will be used during this process, they are:

-Extract By Mask: The extract by mask tool is used to clip a raster using a shapefile or other data format to create a clipped section of a raster.

-Surface Volume: The surface volume tool is used to calculate the volume of a DSM based on the height that the user provides it.

-Raster to TIN: Raster to tin converts a raster file into  a TIN file.

-Add Surface Information: The add surface information tool adds information to a file.  In the case of this lab it adds the surface information to the TIN from pile shapefile.

-Polygon Volume: The polygon volume tool calculates the volume of a polygon.  In this case it calculated the volume of the TIN file of each pile.

Methods:
Pix4D was used to process the imagery in a previous lab, for further details a previous blog post, 
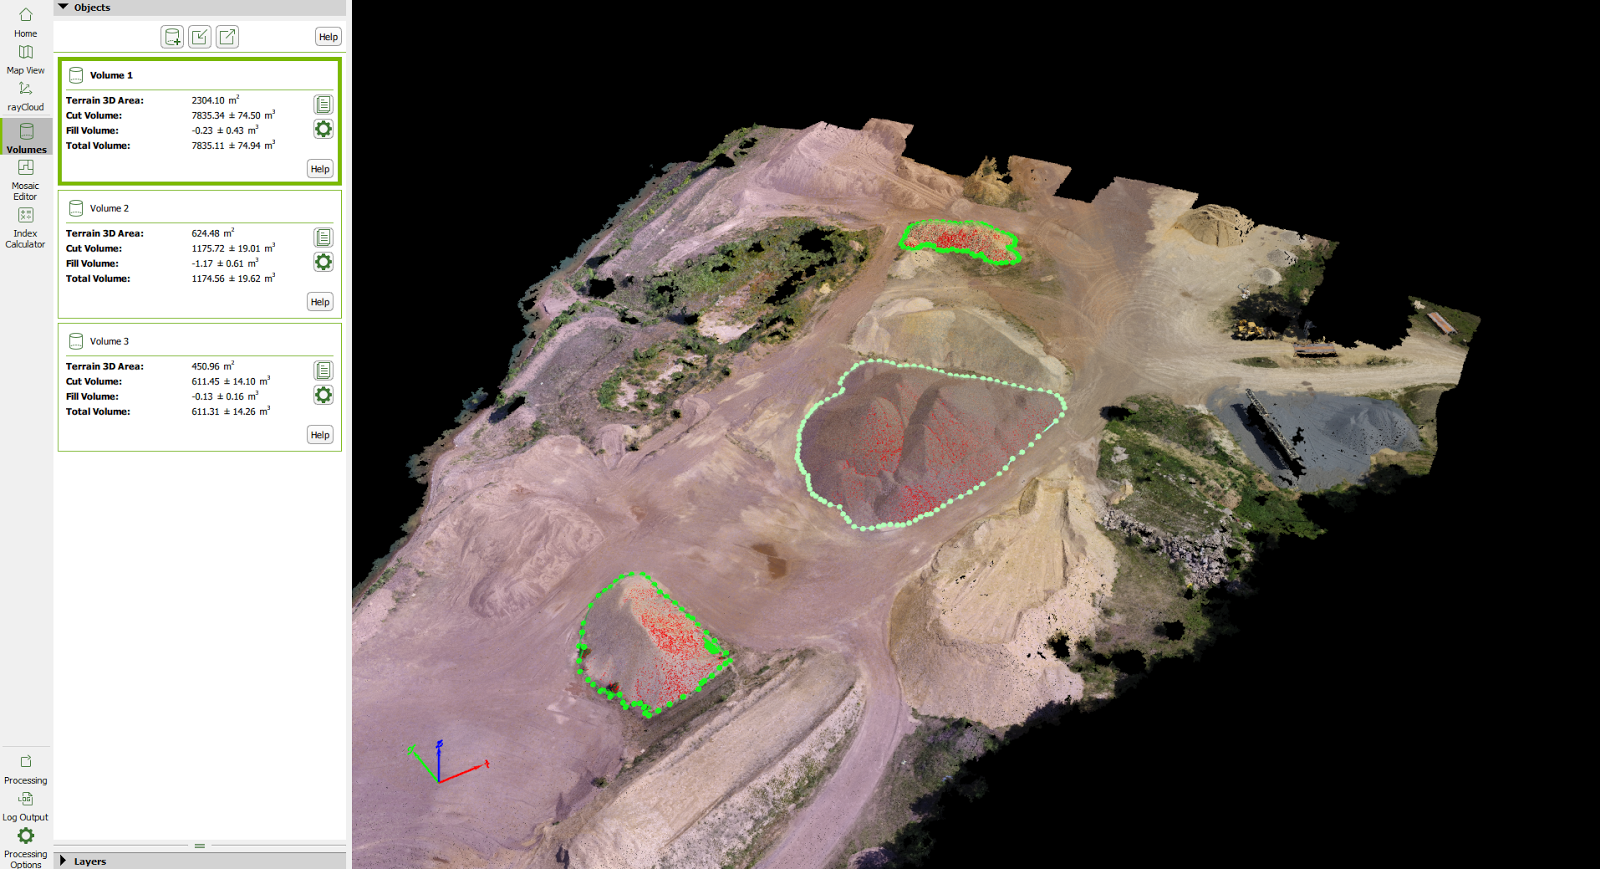
Building Maps with Pix4D, can be examined.  The already processed data was brought into Pix4D to begin the process of volumetrics.  Pix4D has a built in volumes tab that makes the process very user friendly.  The user clicks the volumes tab, then clicks the cylinder shaped tool on the top of the page and is asked to trace the outline of the pile to be examined.  This was done for three seperate piles at the litchfield mine site. The user then clicks the compute button and Pix4D automatically calculates the volumes of the piles.  The resulting figures can be seen on the left of the image below.
To be able to calculate volumetrics in Arcmap is to extract the piles from Pix4D as a shape file to be used in Arcmap.  This was done by using the extract button on the top of the volumes work column and saved into an appropriate folder.  The resulting shapefiles were then used to clip the data from the piles on the Digital Surface Model in ArcMap.  The Extract by Mask Tool was used for this.  The DSM was the input, and the pile shapefile was used as the feature mask data.  The result was clipped rasters of the separate piles.  
 
The next step was to use the tool surface volume to find out the volumes of each of the piles. The clipped raster file was used as the input, a text file output was created, the reference plane was set to above to find the volume above a certain height, the identify tool was used to find the base height, which was then entered as the plane height and the tool was ran.  This resulted in a table that provided the volume of the pile.

The following model illustrates the steps used to find the volumes of the individual piles.
The next process was to turn the rasters into TIN files to find the pile volumes.  The first tool used was raster to tin.  For this tool the clipped pile raster file was inputted and the default parameters were left and the tool was ran.  The raster to tin tool did not add surface information to the TIN file. The Add Surface Information tool needs to be ran next to add the surface information from the original clipped surface file added from Pix4D to the TIN. The original clipped shapefile is used as the input, the TIN is the file getting the surface information and the Z minimum will be created.
Now that the TIN file has surface information it is ready to be used to find the pile volume.  To do this the Polygon Volume tool was used. The TIN was the surface input, pile surfaces was the input feature class, Z_Min. field that was just created was used as the height field, and the reference plane was set to find the volume of the surface above the Z_Min field.  The tool was ran and a output volume was added to the surface shapefile of each pile
The model below illustrates the workflow for measuring volumetrics in ArcMap by creating a tin from a DSM then using the polygon volume tool. 

The volumes of the three piles were now calculated using Pix4D, the Surface Volume tool in ArcMap and the Polygon Volume tool in Arcmap.  Now the data needs to be put together and presented in a organized manner.


Discussion:
Three different methods were used to compute volumetrics of three different stock piles in the Litchfield mine.  The results for each pile varied slightly for each different method.
The resulting volumes for each pile were slightly different for each method.  The volume for each pile was the lowest for the Pix4D volume.  This could be because it was hard to get a completely accurate trace of the pile or the way the program calculates it.  The surface volume tool had volumes right in the middle for piles 2 and 3 and had the highest volume for pile 1.  The surface volume tool might not be the most accurate because the user is providing the base level on which the tool bases the measurement off and that could skew the data.  The polygon volume tool had the highest volumes for the second and third piles and the middle value for the first pile.  This was should be the most accurate because it is using the surface information to measure the lowest point then taking the volume of everything above that. 

Conclusion:
Using UAS to for stock pile volumetrics has huge advantages.  Volumetrics for a lot of data can be completed in a much shorter time than it would take the traditional way.  One person could do it for a whole mine where as the process would require more time and expenses to do it by hand.  There are multiple ways to do it and each one of them has their advantages.  Pix4D can give a relatively accurate measure of volume by just outlining the stock pile.  The tools in ArcMap give a more accurate measure but take more time and more knowledge by the user.     

Monday, March 27, 2017

Processing Multi-Spectral UAS imagery For Value Added Data Analysis

Introduction:
Due to the advancement of technology UAS imagery can now be used to do things that could never be done before.  The advancement of camera technology allows for a very accurate assessment of vegetation health to take place.  This lab goes through processing and creating images taken with the MicaSense RedEdge sensor for further data analysis.  Imagery taken with a normal RBG sensor can be manipulated to see vegetation health, this is done by creating a false color infrared image.  The RedEdge sensor has an additional band between the red and near infrared, they call it the RedEdge, this allows for some of the most accurate vegetation health analysis.  In this lab a series of images and maps will be created to show the differences between a normal false color IR and a false color RedEdge. The images were taken at a house in Fall Creek Wisconsin.

Methods:
The first step of the process was to load the images into Pix4D to create an Orthomosaic Geotiff of the study area.  This was done similarly as previous lab with the exception of using the Ag-Multispectral Processing template. The second step was to create a composite image of all the bands together.  This was done in ArcMap by using the Composite Bands Tool.  The resulting image can be viewed with a variety of different band combinations. The final step to creating maps that can be used for value added analysis was to create a permeable/impermeable surface map using ArcGIS Pro.

Results:
The first thing to be noted is that only 69% of the images were calibrated successfully when processing the imagery in Pix4D, this is due to pilot error.  The camera was turned on when the UAS was still climbing to the proper altitude.  This resulted in images that were not successfully tied into the image.  If this was a real world application the site would be flown again to get better data.
The .tif files were then brought into ArcMap and combined together to create a composite image.  The bands can be combined in a number of ways to create a number of different images.  This first map is in RGB and is how we see through our eyes. The band combination for this image is 3,2,1.

The second map uses bands 5,3,2 to create a false color infrared image.  This uses the infrared, red and green bands to show vegetation.  Vegetation in the image show up as red because the IR band reflects off the vegetation at a cellular level.  The darker the red the vegetation is the healthier it is.
The final composite map was created with the RedEdge 


Conclusion:
The RedEdge sensor gives a more detailed analysis of vegetation health by providing an extra band.  From these images a Pervious/Impervious surface map was created.  The map is not perfect but it shows where the house and road are. The shadow on the upper left hand corner of the house is mistakenly labeled as pervious.  This map would have to be fixed to be used in a real world application.

Sunday, March 12, 2017

Processing Pix4D imagery with GCPs

Introduction:
This project introduces the user to manually tying Ground Control Points (GCP's) to UAS imagery in Pix4D.  It is virtually the same as the previous 'Building maps with Pix4D' lab with the exception of manually adding ground control points.  The ground control points in this lab were physically places at the site of the imagery by the previous class before they took the flight data.

Methods:
The method to add pictures and process them is the same process as the 'Building maps with Pix4D' lab except for one step before the processing is actually started.  When the user gets to the main Pix4D screen, they want to go to Project - GCP/MTP Manager- and import their GCP coordinates from a text file.
 The next step is to run the initial processing.  After that is complete the it time to manually edit the GCP's to tie them to each individual image.  This can be done by clicking basic editor.  The user will then click on a GCP from the list and a list of images that are near that point will pop up.  The user will then click on a image and select the center of the point.  This is done for 5-10 GCP's in the data set and the program will automatically tie the rest down.
When the user finishes tying GCP's to images, it is time to reoptimize.  This ties the images down to the GCP's in the system.  If this is done correctly it is time to run the rest of the processing to get a point cloud and a DSM.

GCP's and Data Quality:
In the previous lab, the same imagery was processed without using GCP's.  This resulted in a good looking point cloud and DSM.  Pix4D automatically generates GCP's from the image data to tie the images to a location on earth.  To the untrained professional this may be enough.  Manually placing GCP's at a project site and taking their location with a highly accurate GPS allows for the user to input these into Pix4D and tie them to the imagery.  This creates maps that are highly accurate to the real world.  Highly accurate imagery and maps is highly valuable in many situations.

Maps:


The resulting map is the exact same as when processing it without adding GCP's.  The real benefit is with the spatial accuracy of the files.  This can be seen in the report that Pix4d creates when it finishes processing.
 No GCP

GCP's

The X variance when using GCP's is almost 7% higher than when done without GCP's.  This is saying that each point is within one meter of the actual location on earth.  The reason the Y variance is higher with the GCP's is because two flights were used and the data with two flights had more variance in the Y direction than the data with a single flight.  That is why it is lower than the first data set that was just one flight.

Conclusions:
In order to get highly accurate positional data from UAS data, GCP's must be incorporated especially if a local datum is not available.  If taking flights in a remote country or location GCP's may be the only option to tying the images to the earth.  The use of GCP's create more accurate data that is highly beneficial to the user in the long run.